The latest Philippine HIV estimates show that by the end of 2025, there will be 252,800 estimated People Living with HIV (PLHIV) in the country.
HIV & AIDS Continuum Care
National Care Cascade as of June 2025
As of June 2025, 144,192 (57% of the estimated) PLHIV have been diagnosed or laboratory-confirmed, and are currently living or not reported to have died. Further, 95,556 (66% of the diagnosed) PLHIV are currently on life-saving Antiretroviral Therapy (ART), of which 51,206 (54%) PLHIV have been tested for viral load (VL) in the past 12 months. Among those tested for VL, 44,714 (87%) were virally suppressed. However, only 47% were virally suppressed among PLHIV on ART.
Figure 1. National Care Cascade as of June 2025
Compared to the previous reporting period, diagnosis coverage increased by 2%, and viral suppression among PLHIV on ART increased by 7%, which can be attributed to more complete report submissions. Treatment coverage remained the same.
D: Estimated Number of PLHIV
D: Number of Diagnosed PLHIV
D: Number of PLHIV on ART
About the 95-95-95 targets & PLHIV estimates (summary)
The 95-95-95 targets are global goals by UNAIDS: by 2030 aim for 95% of PLHIV to know their status, 95% of those diagnosed to be on treatment, and 95% of those on treatment to be virally suppressed. The Philippines integrated these into national plans (7th AMTP 2023-2028).
PLHIV estimates are modeled annually using national surveillance and survey data (HARP, IHBSS, LaBBS, census and program data) and validated with technical partners to guide policy and measure progress.
Definitions (summary):
- Diagnosed PLHIV: cases in the registry who are alive or not reported dead.
- PLHIV on ART: PLHIV who recently accessed ARV refill and have not run out of pills for 30+ days.
- Virally suppressed: PLHIV on ART with viral load ≤50 copies/mL.
Prevention
Figure 2. Quarterly PrEP Enrollment as of June 2025
In April–June 2025, 6,077 clients were newly enrolled to PrEP, a 3% decrease compared to the same period in 2024 (6,283). Of these, 1% were under 18, 41% were 18–24, 44% were 25–34, and 14% were 35+ years old. Most new enrollees were from NCR (32%), Region 4A (20%), and Region 3 (11%).
Since March 2021, 67,820 clients have enrolled in PrEP. Of these, 96% were male and 63% were 25 or older. The majority (86%) registered at facilities in NCR, CALABARZON, and Central Luzon. As of June 2025, only 33% (22,562) returned for a PrEP refill, while 18% (12,283) were new enrollees. Of the 32,975 non-returnees, 3% (1,123) tested positive for HIV.
PrEP is most heavily used by young key populations and young adults aged 18–34, and is most widely distributed in Greater Metro Manila where most cases occur.
Diagnosis
4,705
274
In April–June 2025, 4,979 confirmed HIV-positive individuals were reported, a 6% decrease from last year. Of these, 1,026 (21%) had advanced HIV infection, which is 31% lower than last year. The average daily cases dropped by 5% to 55 per day.
Of the new cases, 94% were male and 6% female, with ages ranging from 1 to 90 (median: 27). By age: <15 y/o (<1%), 15–24 (34%), 25–34 (46%), 35–49 (18%), 50+ (3%).
Most identified as cisgender (69%), with 3% transgender women, <1% transgender men, <1% neither, 1% others, and 26% with no gender data. 81% were confirmed in Certified Rapid HIV Diagnostic Algorithm Labs, 19% in the National Reference Laboratory.
Figure 3. Number of Monthly Newly Diagnosed HIV Cases (Jan–Dec, 2023–2025)
Since 1984, 153,798 confirmed HIV cases have been reported in the Philippines. Monthly new diagnoses have steadily increased since 2021: 1,027 in 2021, 1,244 in 2022 (+21%), 1,435 in 2023 (+15%), 1,459 in 2024 (+2%), and 1,679 in Q2 2025 (+16% vs. last year).
The number of reporting Certified rHIVda Confirming Laboratories (CrCLs) in OHASIS grew from 26 in 2021 to 118 as of June 2025, supporting expanded diagnosis nationwide.
Geographic Distribution
From April to June 2025, the regions with the highest reporting of newly diagnosed cases were NCR, CALABARZON (Region 4A), Central Luzon (Region 3), Central Visayas (Region 7), SOCCSKSARGEN (Region 12), Western Visayas (Region 6), and Davao (Region 11), accounting for 74% (3,657) of the total cases, while 26% (1,281) were reported from other regions.
Between June 2020 and June 2025, these same regions (minus Region 12) contributed to 73% (55,696) of the total reported cases. The remaining 27% (20,717) were distributed across other regions.
From 1984 to June 2025, NCR and Regions 4A, 3, 7, 11, and 6 consistently report the highest number of cases, with a total of 117,369 cases, representing 76% of all reported cases. During this period, 35,168 cases (23%) were reported from other regions, 13 cases (<1%) from overseas, and 1,233 cases (<1%) had no data on region of residence.
Apr–Jun 2025 (n=4,979)
| Region | Number of Cases | % |
|---|---|---|
| NCR | 1117 | 23% |
| R4A | 870 | 18% |
| R3 | 549 | 11% |
| R7 | 367 | 7% |
| R12 | 256 | 5% |
| R6 | 249 | 5% |
| R11 | 249 | 5% |
| NIR | 184 | 4% |
| R1 | 149 | 3% |
| R10 | 149 | 3% |
| R9 | 133 | 3% |
| R5 | 128 | 3% |
| R4B | 91 | 2% |
| R8 | 51 | 1% |
| CARAGA | 73 | 1% |
| CAR | 51 | 1% |
| BARMM | 29 | 1% |
1984–Jun 2025
| Region | CrCls as of Jun 2025 | Jan 2025–Jun 2025 (n=10,071) | Jun 2020–Jun 2025 (n=76,815) | Jan 1984–Jun 2025 (n=153,798) |
|---|---|---|---|---|
| NCR | 16 | 2,368 (48%) | 19,846 (26%) | 48,972 (32%) |
| R4A | 16 | 1,774 (36%) | 13,910 (18%) | 25,741 (17%) |
| R3 | 12 | 1,102 (22%) | 8,819 (11%) | 16,220 (11%) |
| R7 | 5 | 590 (12%) | 4,965 (6%) | 11,347 (7%) |
| R12 | 3 | 555 (11%) | 4,313 (6%) | 8,599 (6%) |
| R6 | 10 | 505 (10%) | 3,843 (5%) | 7,406 (5%) |
| R11 | 5 | 249 (5%) | 3,366 (4%) | 6,393 (4%) |
| NIR | 6 | 353 (7%) | 2,576 (3%) | 4,331 (3%) |
| R1 | 7 | 149 (3%) | 2,397 (3%) | 4,156 (3%) |
| R10 | 7 | 149 (3%) | 2,397 (3%) | 4,156 (3%) |
| R9 | 2 | 133 (3%) | 2,113 (3%) | 3,206 (2%) |
| R5 | 5 | 128 (3%) | 1,791 (2%) | 2,706 (2%) |
| R4B | 5 | 91 (2%) | 1,689 (2%) | 2,074 (1%) |
| R8 | 1 | 51 (1%) | 1,259 (2%) | 2,592 (1%) |
| CARAGA | 1 | 73 (1%) | 728 (1%) | 1,355 (1%) |
| CAR | 0 | 51 (1%) | 389 (0.5%) | 602 (<1%) |
| BARMM | 0 | 29 (1%) | 75 (0.2%) | 602 (<1%) |
Sex and Age Distribution
Majority of the total reported cases (145,147,94%) were males and8,641 (6%) were females [Figure 5]. Since 2011, the proportion of males among the newly diagnosed cases has consistently been at least 94%.
By age group,533 (<1%) were below 15 years old,45,863 (30%) were among the youth aged 15-24 years old, half (76,347, 50%) were 25-34 years old,27,022 (18%) were 35-49 years old, and3,951 (3%) were 50 years and older. The age of diagnosed cases ranged from <1 to 90 years old (median: 28 years).
Moreover, diagnosed HIV cases are getting younger with the predominant age group shifting from among 35-49 years old in 2002 to 2005, to 25-34 years old starting 2006 [Figure 6].
Cumulatively, among age groups, the highest percent change in the past five years occurred among the <15 age group (+323%), followed by the 15-24 age group (+302%).
Figure 5. Proportion of diagnosed HIV cases by sex, Jan 1984 – June 2025
| Age Group | Cases | Percent |
|---|---|---|
| <15 | 533 | <1% |
| 15-24 | 45,863 | 30% |
| 25-34 | 76,347 | 50% |
| 35-49 | 27,022 | 18% |
| 50+ | 3,951 | 3% |
Figure 6. Distribution of diagnosed HIV cases, by age group, 1984 – Jun 2025
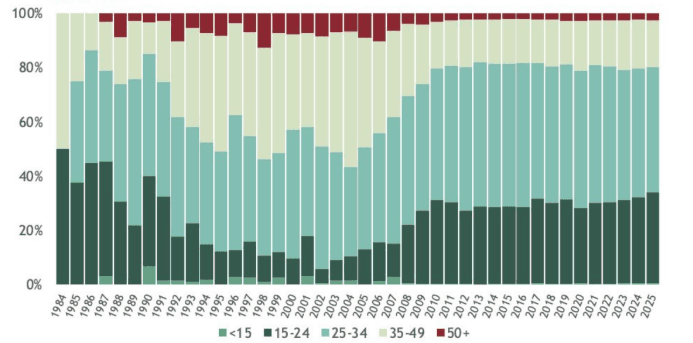
Table 2. Percent increase between June 2020 and June 2025
of cumulative cases by age group
| As of June 2020 | As of June 2025 | % Increase | |
|---|---|---|---|
| <15 | 126 | 533 | 323.02% |
| 15-24 | 11,416 | 45,863 | 301.74% |
| 25-34 | 20,225 | 76,347 | 277.49% |
| 35-49 | 6,968 | 27,022 | 287.80% |
| 50+ | 1,102 | 3,951 | 258.53% |
| TOTAL | 39,837 | 153,716 | 285.86% |
Mode of Tranmission
In the second quarter of this year, 4,756 (96%) newly reported cases had acquired HIV through sexual contact – 3,544 through male-male sex, 641 through male-male/female sex14, and 571 through male-female sex. Meanwhile, 23 (<1%) reported sharing of infected needles, 9 (<1%) through mother-to-child transmission, and 191 (4%) had no data on mode of transmission at the time of diagnosis [Table 2].
Table 3. Number of newly reported HIV cases by mode of transmission, Q2 2025
| Mode of Transmission | Cases | Percent |
|---|---|---|
| Sexual Contact | 4,756 | 96% |
| Male-male | 3,544 | — |
| Male-male/female14 | 641 | — |
| Male-female | 571 | — |
| Sharing of infected needles | 23 | <1% |
| Mother-to-child | 9 | <1% |
| No data | 191 | 4% |
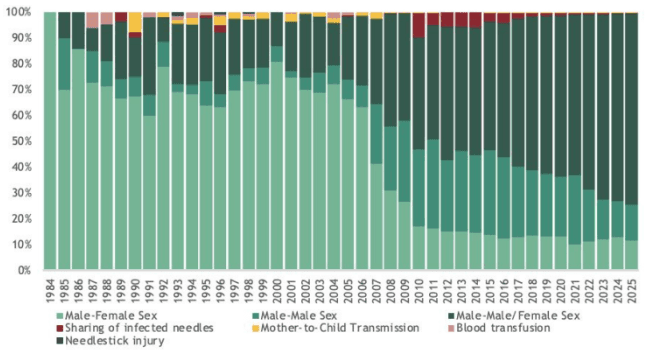
Sexual contact has consistently been the leading mode of HIV transmission among newly diagnosed cases over the years [Figure 7]. From January 1984 to June 2025, of the 153,798 reported cases, 148,020 (96%) were acquired through sexual contact. This includes 92,738 cases from male-male sex, 34,461 from male-male/female sex, and 20,821 from male-female sex [Table 3].
In contrast, there has been a notable increase in reported HIV cases resulting from mother-to-child transmission. Out of a total of 410 cases, almost half (49%, 202) were reported between June 2020 and June 2025.
Sharing of infected needles accounts for 2% of total cases, while blood/blood product and needlestick injury transmissions are rare. About 2% of cases have an unknown mode of transmission. Most males (88%) acquired HIV through sex with another male, while 93% of females acquired it through sex with a male. Regional patterns mirror national trends, with most needle-sharing cases in Region 7 and most mother-to-child cases in NCR, Region 4A, and Region 3.
Figure 7. Distribution of diagnosed HIV cases, by mode of transmission, Jan 1984 – June 2025'16
Advanced HIV Disease (AHD)
Reporting of Advanced HIV Disease (AHD)17 cases only started in 2011. Among the total reported cases, 43,695 (30%) were diagnosed with AHD, 9% higher compared to the same quarter of the preceding year. Notably, data on immunologic or clinical criteria at the time of diagnosis were unavailable for 44,585 (30%) cases. HIV cases without immunologic or clinical tagging were classified as non-AHD.
From 2011 to 2020, there was a notable increase in the proportion of cases with AHD [Figure 8], rising from 9% in 2011 with a median baseline CD4 count of 128 cells/mm3, to 37% in 2020 with a median baseline CD4 count of 198 cells/mm3.
Over the past 5 years, there was a 16% decrease in the proportion of AHD cases, with a median CD4 count of 225 cells/mm3. The proportion of AHD cases has been steadily declining since 2021, with the current proportion being 16% lower than in 2020. In comparison to the second quarter of 2024, the median baseline CD4 count saw a decrease from 226 cells/mm3 to 222 cells/mm3 in the second quarter of 2025.
Figure 8. Proportion of newly diagnosed HIV cases with advanced HIV disease17, 2011 – June 2025
Treatment
In April to June 2025, there were 4,316 people with HIV who were enrolled to treatment, of which, 4,262 (99%) were on the first line regimen, 4 (<1%) were on second line regimen, and 50 (1%) were on other lines of regimen. Among them, 19 (<1%) were less than 15 years old, 1,426 (33%) were 15-24 years old, 1,954 (45%) were 25-34 years old, 805 (19%) were 35-49 years old, and 109 (3%) were 50 years and older. The median CD419 of these patients upon enrollment was at 202 cells/mm3.
Apr-Jun 202518
at enrollment (in cells/mm3)19
Table 4. Number of PLHIV ever enrolled to ART by treatment outcome and region as of June 2025
| Region of Treatment Facility | Alive on ART23 (n=95,556) | Lost to Follow-up24 (n=29,286) | % LTFU |
|---|---|---|---|
| NCR | 40,162 | 12,967 | 24% |
| 4A | 10,993 | 2,729 | 19% |
| 3 | 8,620 | 2,220 | 19% |
| 7 | 6,856 | 2,820 | 27% |
| 11 | 5,880 | 1,962 | 24% |
| 6 | 4,458 | 630 | 11% |
| 12 | 3,284 | 872 | 20% |
| NIR | 2,397 | 549 | 17% |
| 10 | 1,960 | 1,104 | 34% |
| 1 | 1,942 | 401 | 16% |
| 5 | 1,664 | 507 | 21% |
| 2 | 1,591 | 207 | 11% |
| 9 | 1,261 | 428 | 23% |
| 4B | 1,247 | 409 | 23% |
| CAR | 1,150 | 227 | 16% |
| 8 | 1,001 | 644 | 37% |
| Caraga | 984 | 389 | 26% |
| BARMM | 103 | 57 | 35% |
Among the 131,381 people living with HIV (PLHIV) who have ever been enrolled on antiretroviral therapy (ART) since 2002, a total of 95,556 individuals aged 1 to 84 years old (median age: 33 years) were alive on ART as of June 2025. Of these, 93,441 (98%) were on a first-line regimen, 898 (1%) were on a second-line regimen, and 1,217 (1%) were on other lines of regimen.
As of June 2025, 29,304 (22%) individuals who were previously on ART were no longer receiving treatment. This group includes 29,286 individuals who were lost to follow-up, 5 who refused to continue ART for various reasons, and 13 who reported migrating overseas [Table 4].
63% of the PLHIV on ART are concentrated in the Greater Manila Area (GMM), which includes NCR, CALABARZON, and Central Luzon. Conversely, NCR, Central Visayas, and CALABARZON contribute to 64% of the total number of PLHIV not on treatment in the country.
On the other hand, the highest rates of clients lost to follow-up are observed in Eastern Visayas (37%), followed by BARMM (35%) and Northern Mindanao (34%).
Viral Load (VL) Testing and Suppression
Among the PLHIV on ART as of June 2025, a total of 91,466 individuals had been enrolled in ART for at least 3 months and were tagged as eligible for viral load testing. Of these eligible individuals, 51,202 (56%) PLHIV underwent viral load testing within the past 12 months. Specifically, 12,356 (24%) were tested between April to June 2025, 17,915 (35%) were tested between January to March 2025, 12,430 (24%) were tested between October and December 2024, and 8,501 (17%) between July and September 2024.
Figure 9. Viral Load Testing and Suppression among PLHIV on ART, 2019–2025
| Year | PLHIV on ART | VL Tested | VL Suppressed | % Tested | % Suppressed |
|---|---|---|---|---|---|
| 2019 | 39,162 | 11,269 | 9,240 | 29% | 82% |
| 2020 | 43,367 | 7,675 | 6,457 | 18% | 84% |
| 2021 | 51,863 | 17,129 | 14,547 | 33% | 85% |
| 2022 | 63,221 | 17,957 | 15,851 | 25% | 88% |
| 2023 | 75,300 | 31,330 | 27,468 | 42% | 88% |
| 2024 | 90,568 | 41,746 | 36,633 | 46% | 88% |
| 2025 | 95,556 | 51,202 | 44,712 | 56% | 87% |
Furthermore, among the 51,202 PLHIV on ART who were tested in the past 12 months as of June 2025, 44,712 (87%) were virally suppressed (≤50 copies/mL) while 6,490 (13%) were not virally suppressed. Moreover, there has been a notable 93% increase in viral testing coverage from January 2020 to June 2025. On the other hand, viral suppression rates have ranged from 82-88% since 2019 while viral load testing coverage remained below 50% until 2024. As of June, VL testing coverage reached a record high of 56% [Figure 9].
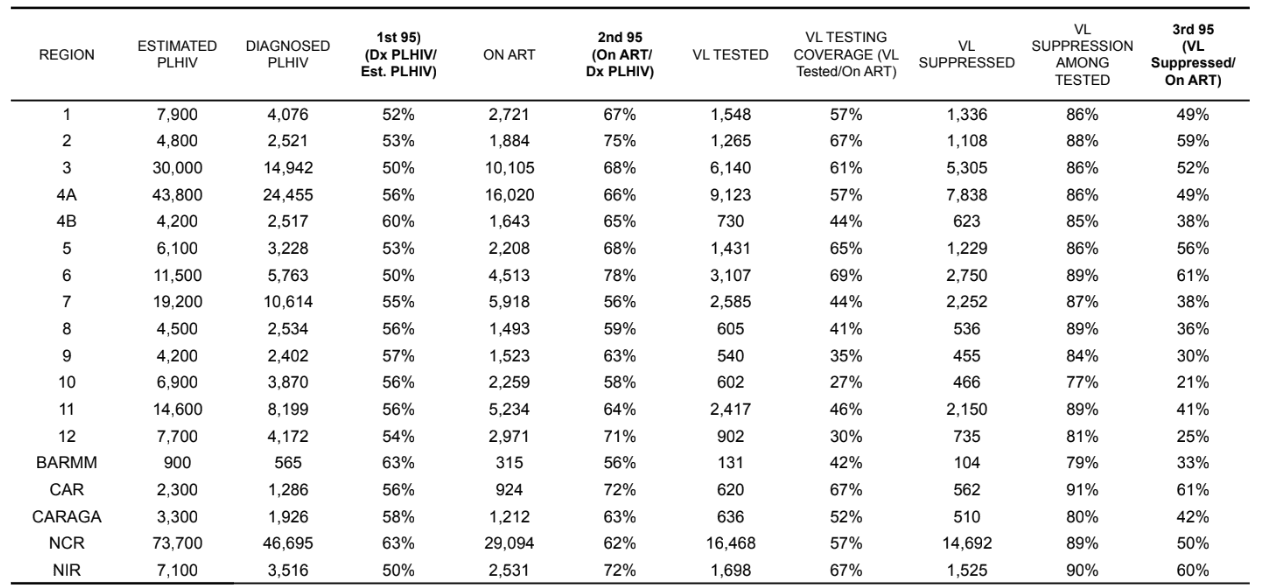
Regionally, Ilocos Region (1), Cagayan Valley (2), Central Luzon (3), CALABARZON (4A), Bicol (5), Western Visayas (6), Cordillera Administrative Region (CAR), Caraga, National Capital Region (NCR), and Negros Island Region (NIR) have reached viral load testing coverage exceeding 50%, with suppression rates ranging from 75 to 92%. In contrast, other regions have reported coverage below 50%, with suppression rates varying from 71 to 89% [Table 5].
Mortality
From April to June 2025, there were 161 reported deaths due to any cause among people diagnosed with HIV, 40% lower than the first quarter of the previous year. Two (1%) were <15 years old, 22 (14%) were 15-24 years old at the time of death, 68 (42%) were 25-34 years old, 56 (35%) were 35-49 years old, and 13 (8%) were 50 years old and above.
From 2020 to June 2025, there have been 4,434 deaths reported among diagnosed HIV cases in the Philippines, with more than 500 new deaths reported each year since 2016.
Since January 1984, a total of 9,606 deaths have been reported. Among total deaths, 4,491 (47%) had an advanced HIV disease at the time of diagnosis.29 Among age groups, the largest proportion of reported deaths were among 25-34 years old accounting for 4,251 (44%) of total deaths, followed by 35-49 years old with 2,453 (26%), 15-24 years old with 1,331 (14%), 50 years old and older with 503 (5%), and <15 years old with 67 (1%). 10% of the reported deaths had no reported age at the time of death.
Pregnant Women with HIV
From April to June 2025, there were 47 HIV positive women aged 16 to 45 years old (median: 23 years) who were pregnant at the time of diagnosis. This was a 52% increase compared to the same reporting period last year. The reporting of pregnancy status at the time of diagnosis was integrated into HIV and AIDS Registry of the Philippines in 2011; and since then, a total of 1,063 diagnosed women were reported pregnant at the time of diagnosis.
Among the pregnant women at the time of diagnosis within the past year, 167 (98%) were currently alive. Of these, 117 (69%) were initiated to ART however, only 75 (64%) among them were retained on ART. Of those who were on treatment, only 16 (21%) were tested for viral load, of which 12 (75%) were virally suppressed [Figure 10].
Transgender Women (TGW)
From April to June 2025 there were 162 newly reported cases who identified as transgender women (TGW)30 where 53 (33%) were 15 - 24 years old, 75 (46%) were 25 - 34 years old, 29 (18%) were 35-49 years old, and 5 (3%) were 50 years and older. The age of diagnosis ranged from 16 to 75 years old (median: 27 years).
Of the 2,909 TGW diagnosed with HIV from January 201831 to June 2025, almost all (2,871, 99%) acquired HIV through sexual contact, 6 (<1%) through sharing of infected needles, and 30 (1%) had no data on mode of transmission. By age group, 834 (29%) were 15-24 years old at the time of diagnosis, almost half (1,426, 49%) were 25-34 years old, 576 (20%) were 35-49 years old, and 72 (2%) were 50 years and older, and one had no data on age. The age of diagnosis ranged from 15 to 75 years old (median: 28 years).
Among the diagnosed cases of TGW, 2,717 (93%) were currently alive. Of these, 2,417 (89%) were initiated to ART however, only 1,684 (70%) among diagnosed TGW living with HIV were retained on ART. Of those who were on treatment, only 859 (51%) were tested for viral load with 84% (719) viral load suppression [Figure 11].
Migrant Workers
From April to June 2025, 171 migrant workers were reported, among whom were Filipinos aged 20 to 76 (median: 35). Of the Filipino migrant workers, 148 (87%) were male and 23 (13%) were female. Most (160, 98%) acquired HIV through sexual contact: 98 (57%) through male-male sex, 26 (15%) through sex with both males and females, and 36 (21%) through male-female sex; 10 (6%) had no data on transmission. There was a 19% decrease in HIV diagnoses among migrant workers compared to the same period last year, and a 6% decrease over the past five years.
Since 1984, 10,990 (7%) of diagnosed cases have been migrant workers. Of these, 10,763 (98%) acquired HIV through sexual contact, 20 (<1%) through needle sharing, 9 (<1%) through exposure to blood, 3 (<1%) through needlestick injury, and 189 (2%) had no data on transmission.
Among the diagnosed cases of migrant workers, 10,341 (94%) were currently alive. Of these, 8,490 (82%) were initiated to ART, but only 6,220 (73%) among diagnosed living with HIV were retained on ART. Of those who were on treatment, only 3,597 (58%) were tested for viral load with 90% (3,247) viral load suppression [Figure 12].
People Engaging in Transactional Sex
In April to June 2025, 569 (11%) of the newly diagnosed engaged in transactional sex within the past 12 months. Majority (560, 98%) were males and 9 (2%) were females, their age ranged from 14 to 64 years old (median: 33 years). Of the male cases, 202 (36%) reported accepting payment for sex only, 268 (48%) reported paying for sex only, and 90 (16%) engaged in both. On the other hand, among female cases, 7 (78%) accepted payment for sex, only 2 (22%) reported paying for sex only, and none (0%) engaged in both.
9,527 (55%) of the total cases who had history of transactional sex were diagnosed from 2020 to 2025, of which almost half (47%) of them paid for sex [Table 6].
Since the reporting of transactional sex began in December 2012, a total of 17,151 cases have been reported to HARP32. The majority, 16,673 (97%), were males, while 478 (3%) were females. Among them, 5,780 (34%) accepted payment for sex, 8,615 (50%) paid for sex, and 2,756 (16%) engaged in both.
| Period | Total | Male | Female | Accepted | Paid | Both |
|---|---|---|---|---|---|---|
| Apr-Jun 2025 | 569 | 560 | 9 | 202 | 268 | 90 |
| 2020–2025 | 9,527 | - | - | - | 4,478 | - |
| Since Dec 2012 | 17,151 | 16,673 | 478 | 5,780 | 8,615 | 2,756 |
Among the diagnosed cases who had history of transactional sex, 13,822 (93%) were currently alive. Of these, 12,417 (90%) were initiated to ART however, only 8,861 (71%) among of them were retained on ART. Of those who were on treatment, only 4,701 (53%) were tested for viral load with 86% (4,030) viral load suppression.
HIV & AIDS Surveillance of the Philippines
The HIV & AIDS Surveillance of the Philippines (HASP) is the official record of total number of diagnoses (laboratory-confirmed), ART outcome status and deaths among people with HIV in the Philippines. All individuals in the registry are confirmed by the San Lazaro Hospital STD/AIDS Cooperative Central Laboratory (SACCL) which is the HIV/AIDS National Reference Laboratory (NRL) and DOH Certified Rapid HIV Diagnostic Algorithm - rHIVda Confirmatory Laboratories (CrCLs). Confirmed HIV positive individuals were reported to the DOH-Epidemiology Bureau (EB) and recorded to OHASIS.
ART figures are counts of HIV positive adult and pediatric patients currently enrolled and accessing Antiretroviral (ARV) medication during the reporting period in 292 treatment hubs and primary HIV care treatment facilities that had reported in EB. This report did not include patients who have previously taken ARV but have died, left the country, have been lost to follow-up and/or opted not to take ARV. Lost to follow-up is considered once a person have failed to visit a treatment facility 1 month after the expected date of ARV refill.
HASP is a passive surveillance system. Except for HIV confirmation by the NRL & CrCLs, all other data submitted to the HASP are secondary and cannot be verified. Hence, it cannot determine if an individual’s reported place of residence was where the person got infected, or where the person lived after being infected, or where the person is presently living. This limitation has major implications on data interpretation. Readers are advised to interpret the data with caution and consider other sources of information before arriving at conclusions.
1003 Philippines
+632 8651-7800 local 2952
Care Cascade by Region
Care Cascade by Age Group
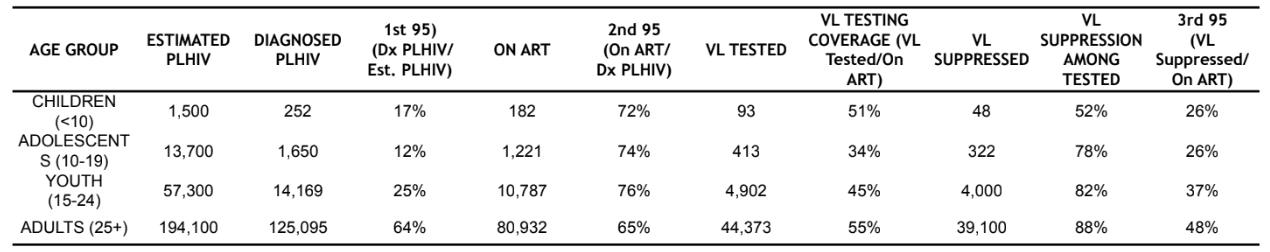
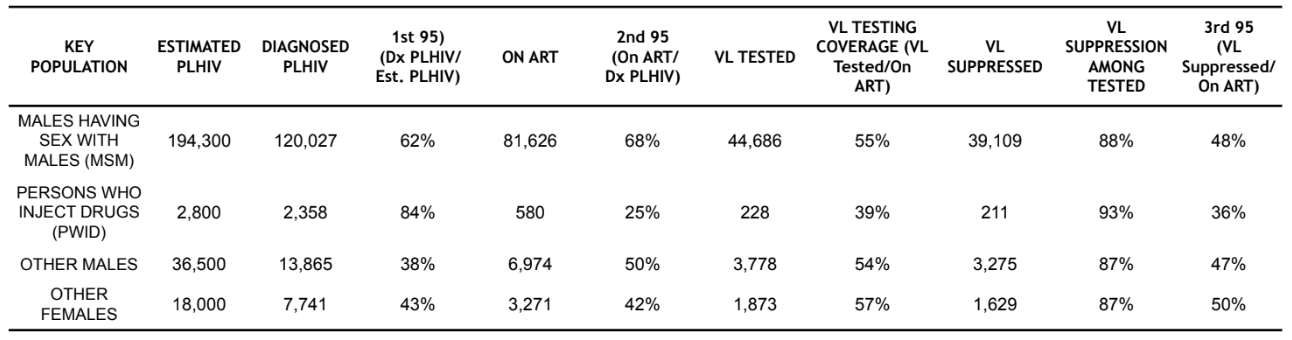
Care Cascade by Key Population